Complete Analysis Tutorial
Walk through a complete RNA-seq analysis pipeline using GSE151427 (human iPSC-derived endothelial cells). Learn how to use every feature of TransXplorer.
Introduction
What is RNA-seq?
RNA sequencing (RNA-seq) is a powerful technology that captures a snapshot of all the genes actively being expressed in your cells at a given moment. Unlike older microarray methods, RNA-seq can detect novel transcripts, alternative splicing events, and provide highly accurate quantification across a wide dynamic range.
In a typical RNA-seq experiment, messenger RNA is extracted from samples, converted to cDNA, and sequenced using high-throughput platforms. The resulting data—millions of short sequence reads—must then be processed through a series of computational steps to extract biological meaning.
What is TransXplorer?
TransXplorer is an automated end-to-end web server for translational RNA-seq analysis and therapeutic discovery. It bridges the gap between raw sequencing data and clinical application by semi-automating complex bioinformatic tasks—enabling researchers without extensive computational expertise to perform publication-quality analysis from start to finish.
The platform covers the complete analytical journey: from optional FASTQ file processing through differential expression analysis, batch effect correction, pathway enrichment, network analysis, drug-target discovery, and clinical validation with TCGA data integration.
- Autonomous batch effect detection using PVCA, kBET, and Silhouette metrics
- Hybrid Gene Regulatory Network combining DoRothEA and TFLink databases across 11 organisms
- Instant therapeutic translation through real-time API integration with DGIdb, ChEMBL, and OpenTargets
- Stable architecture using asynchronous job queues, validated on datasets with 45,000 genes × 48 samples
Tutorial Dataset: GSE151427
In this tutorial, we'll analyze GSE151427—a study of human iPSC-derived endothelial cells comparing two developmental lineages:
| Property | Value |
|---|---|
| GEO Accession | GSE151427 |
| Organism | Homo sapiens |
| Cell Types | CMEC (cardiac mesoderm endothelial cells) vs PMEC (paraxial mesoderm endothelial cells) |
| Source | Human induced pluripotent stem cell (iPSC) derived |
| Samples | 10 samples (5 CMEC, 5 PMEC) |
| Comparison | PMEC vs CMEC (identifying genes differentially expressed between the two EC subtypes) |
What You'll Learn
Quality Control
Assess sample quality, detect outliers, and identify batch effects using PCA and UMAP
Differential Expression
Identify significantly changed genes using DESeq2, edgeR, or limma-voom
Pathway Analysis
Discover enriched biological processes and pathways (GO, KEGG, Reactome)
Drug Discovery
Find FDA-approved drugs and experimental compounds targeting your DEGs
Network Analysis
Build WGCNA, GRN, and PPI networks to understand gene relationships
Cell Deconvolution
Estimate cellular composition using xCell, MCP-counter, or EPIC
Data Input
Supported Input Formats
TransXplorer accepts gene expression count matrices in multiple formats: CSV, TXT, TSV, and XLSX. The matrix should have genes as rows and samples as columns. Importantly, you should upload raw counts (integers)—not normalized values like FPKM or TPM.
Sample Metadata
The metadata file defines your experimental design—which samples belong to which groups, and any batch or covariate information. This is critical for proper statistical modeling of your comparison.
| Sample | Group | Batch | Time |
|---|---|---|---|
| GSM4577968 | CMEC | 1 | day6 |
| GSM4577969 | PMEC | 1 | day6 |
| GSM4577970 | CMEC | 2 | day8 |
| GSM4577971 | CMEC | 2 | day8 |
| GSM4577972 | PMEC | 2 | day8 |
Normalization Methods
Raw counts must be normalized to account for differences in sequencing depth between samples. TransXplorer offers several methods:
- TMM (Trimmed Mean of M-values): Recommended default. Calculates scaling factors by removing genes with extreme expression, providing robust normalization.
- RLE (Relative Log Expression): Used by DESeq2. Calculates a pseudo-reference sample and derives scaling factors from median ratios.
- VST (Variance Stabilizing Transformation): DESeq2-specific transformation that stabilizes variance across the mean—ideal for visualization and clustering.
- CPM/TPM: Counts/Transcripts per million. Simple normalization useful for comparing expression levels across genes.
Exploratory Analysis
Before statistical testing, exploratory analysis reveals patterns in your data and identifies potential confounding factors. This step is crucial for ensuring biological signals aren't obscured by technical artifacts.
Principal Component Analysis (PCA)
PCA reduces the high-dimensional gene expression data (thousands of genes) into a few principal components that capture the most variance. Each point represents a sample, and samples with similar expression profiles will cluster together.
UMAP Visualization
Uniform Manifold Approximation and Projection (UMAP) is a non-linear dimensionality reduction technique that often reveals cluster structures that linear methods like PCA miss. UMAP preserves both local and global data structure, making it excellent for identifying subpopulations.
Loading...
Loading...
Batch Effect Detection
Before vs After Correction
Loading...
Loading...
Differential Expression
Parameters
Volcano Plot
Loading...
DEG Summary
Top DEGs
Loading...
Pathway Enrichment
Results Summary
Enrichment Plot

Gene-Pathway Network
Drug Target Discovery
TransXplorer integrates with DGIdb and OpenTargets to identify potential therapeutic targets.
Analysis Modes
Quick Analysis
Fast DGIdb lookup for rapid screening
Detailed Analysis
OpenTargets clinical evidence
Comprehensive
Combined with prioritization scoring
Drug Prioritization
| Drug | Priority | Score | Targets | Target Genes | Evidence | Phase |
|---|---|---|---|---|---|---|
| TRETINOIN | Very High | 6.58 | 4 | ALDH1A2, APOA1, MYCN, RARB | ⭐⭐⭐ | Approved |
| OCRIPLASMIN | Very High | 6.16 | 4 | COL2A1, COL6A3, LAMA4, LAMC3 | ⭐⭐⭐ | Approved |
| MAVACAMTEN | Very High | 5.74 | 3 | MYH6, MYL4, MYL7 | ⭐⭐⭐ | Approved |
| VANDETANIB | Very High | 5.15 | 2 | LTK, EPHB3 | ⭐⭐⭐ | Approved |
| ACALABRUTINIB | Very High | 5.14 | 2 | BTK, ENO2 | ⭐⭐⭐ | Approved |
Cell Type Deconvolution
Estimate cellular composition using reference-based deconvolution algorithms.
Cell Type Proportions
Loading...
Group Comparison
Loading...
Key Findings
- Endothelial cells: Both groups show high endothelial scores (expected for iPSC-derived ECs)
- CMEC enrichment: Higher neutrophil and fibroblast signatures
- Validation: Results consistent with cardiac vs paraxial mesoderm origins
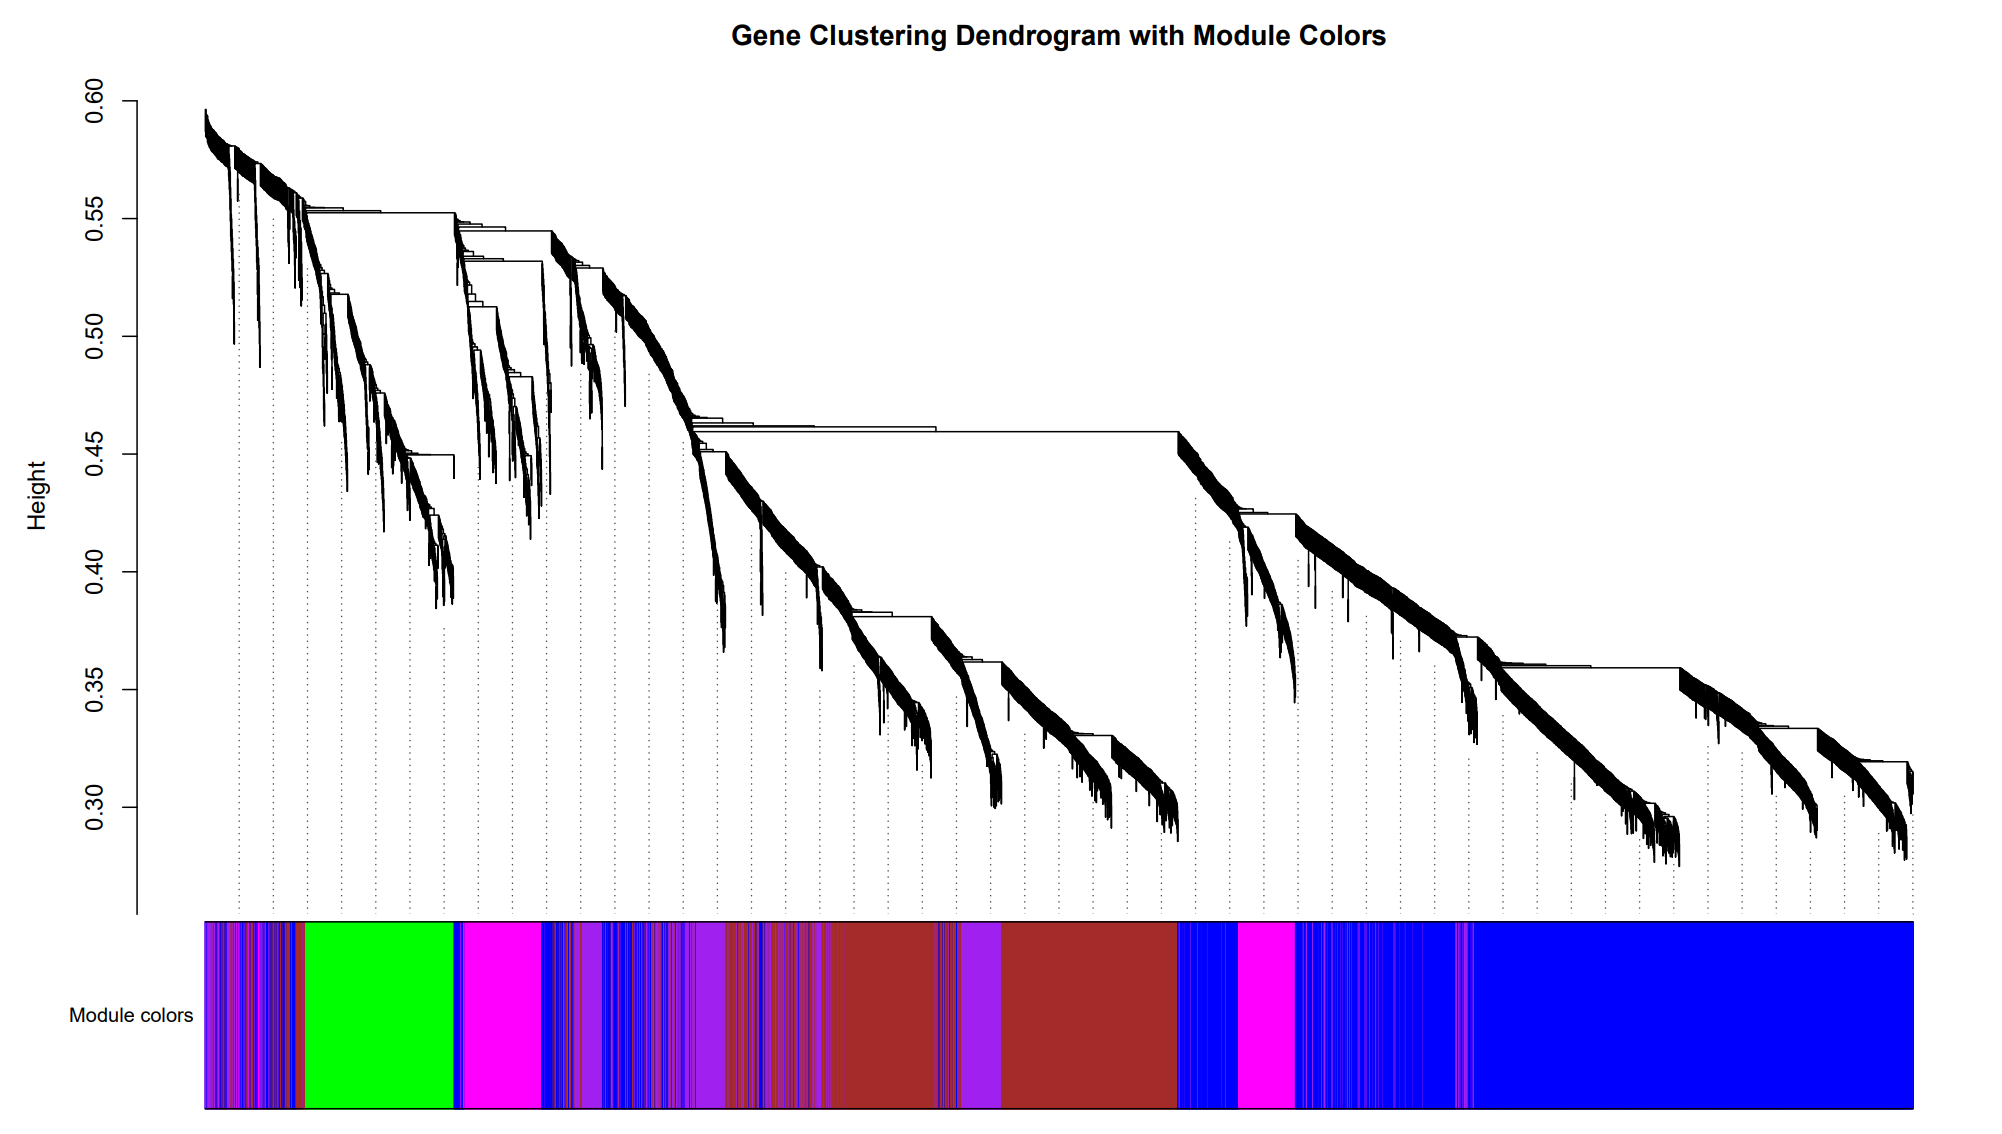
WGCNA Co-expression
Identify modules of highly correlated genes and relate them to experimental conditions.
Gene Dendrogram
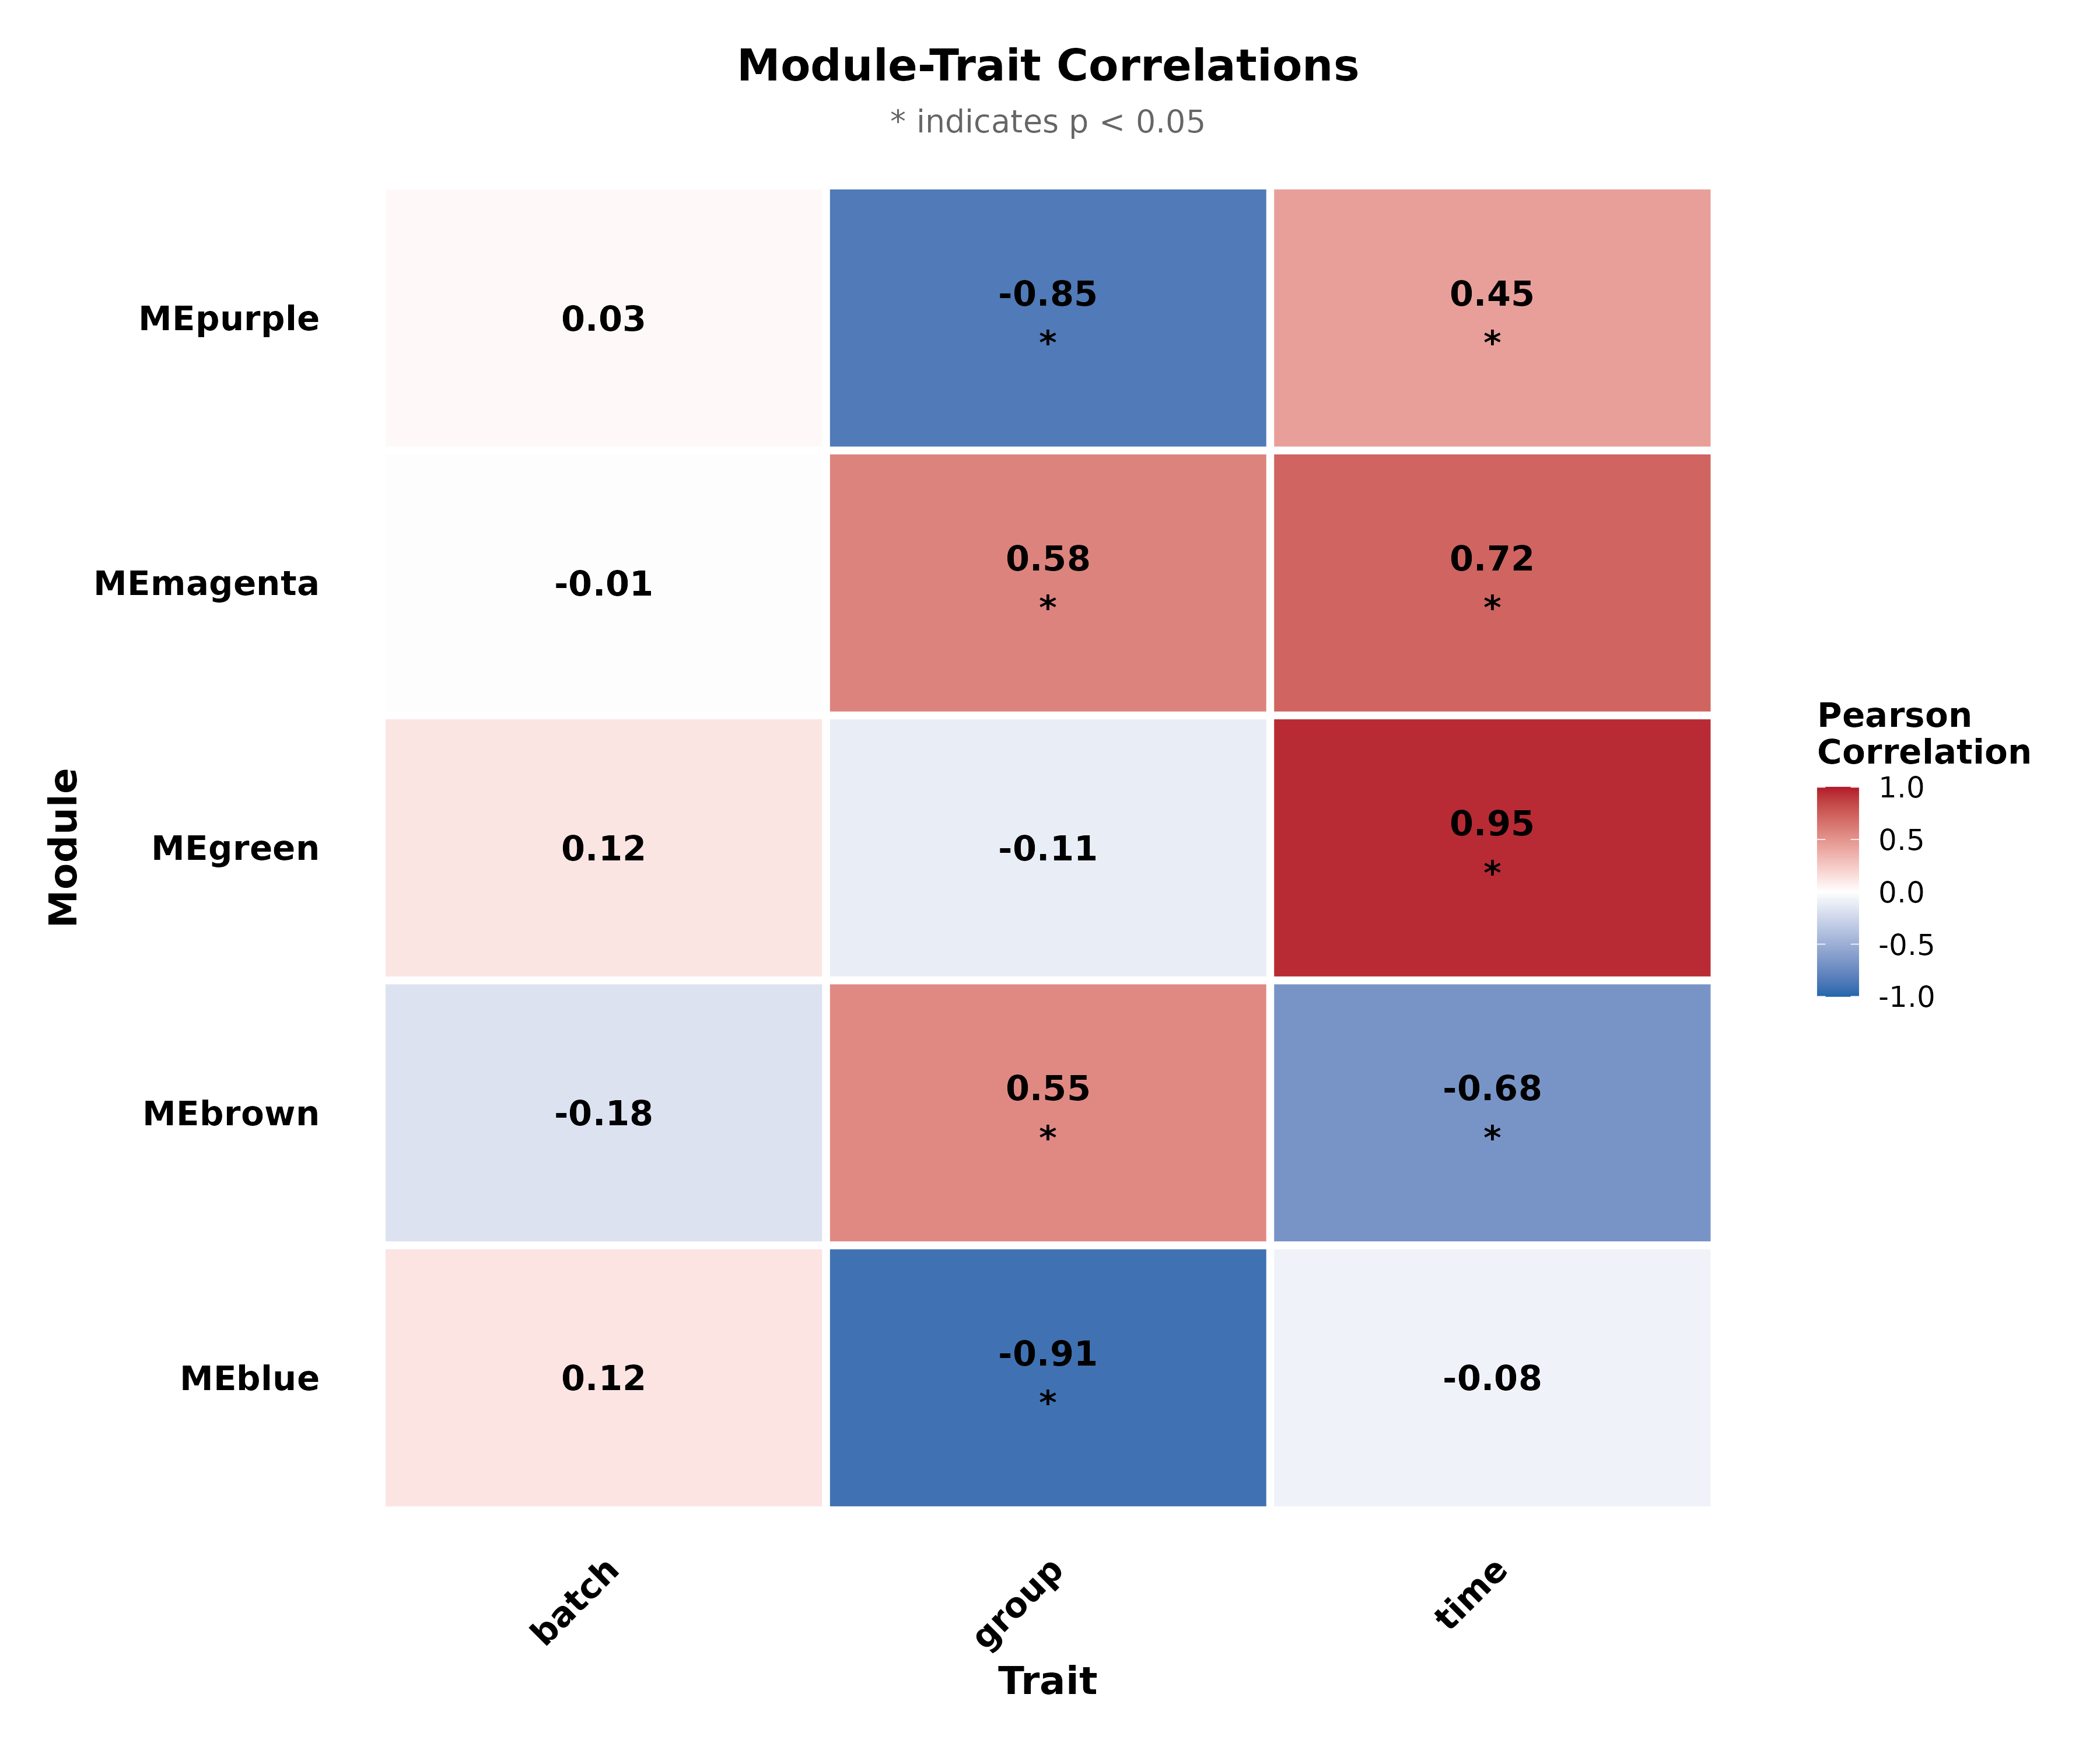
Module-Trait Correlation
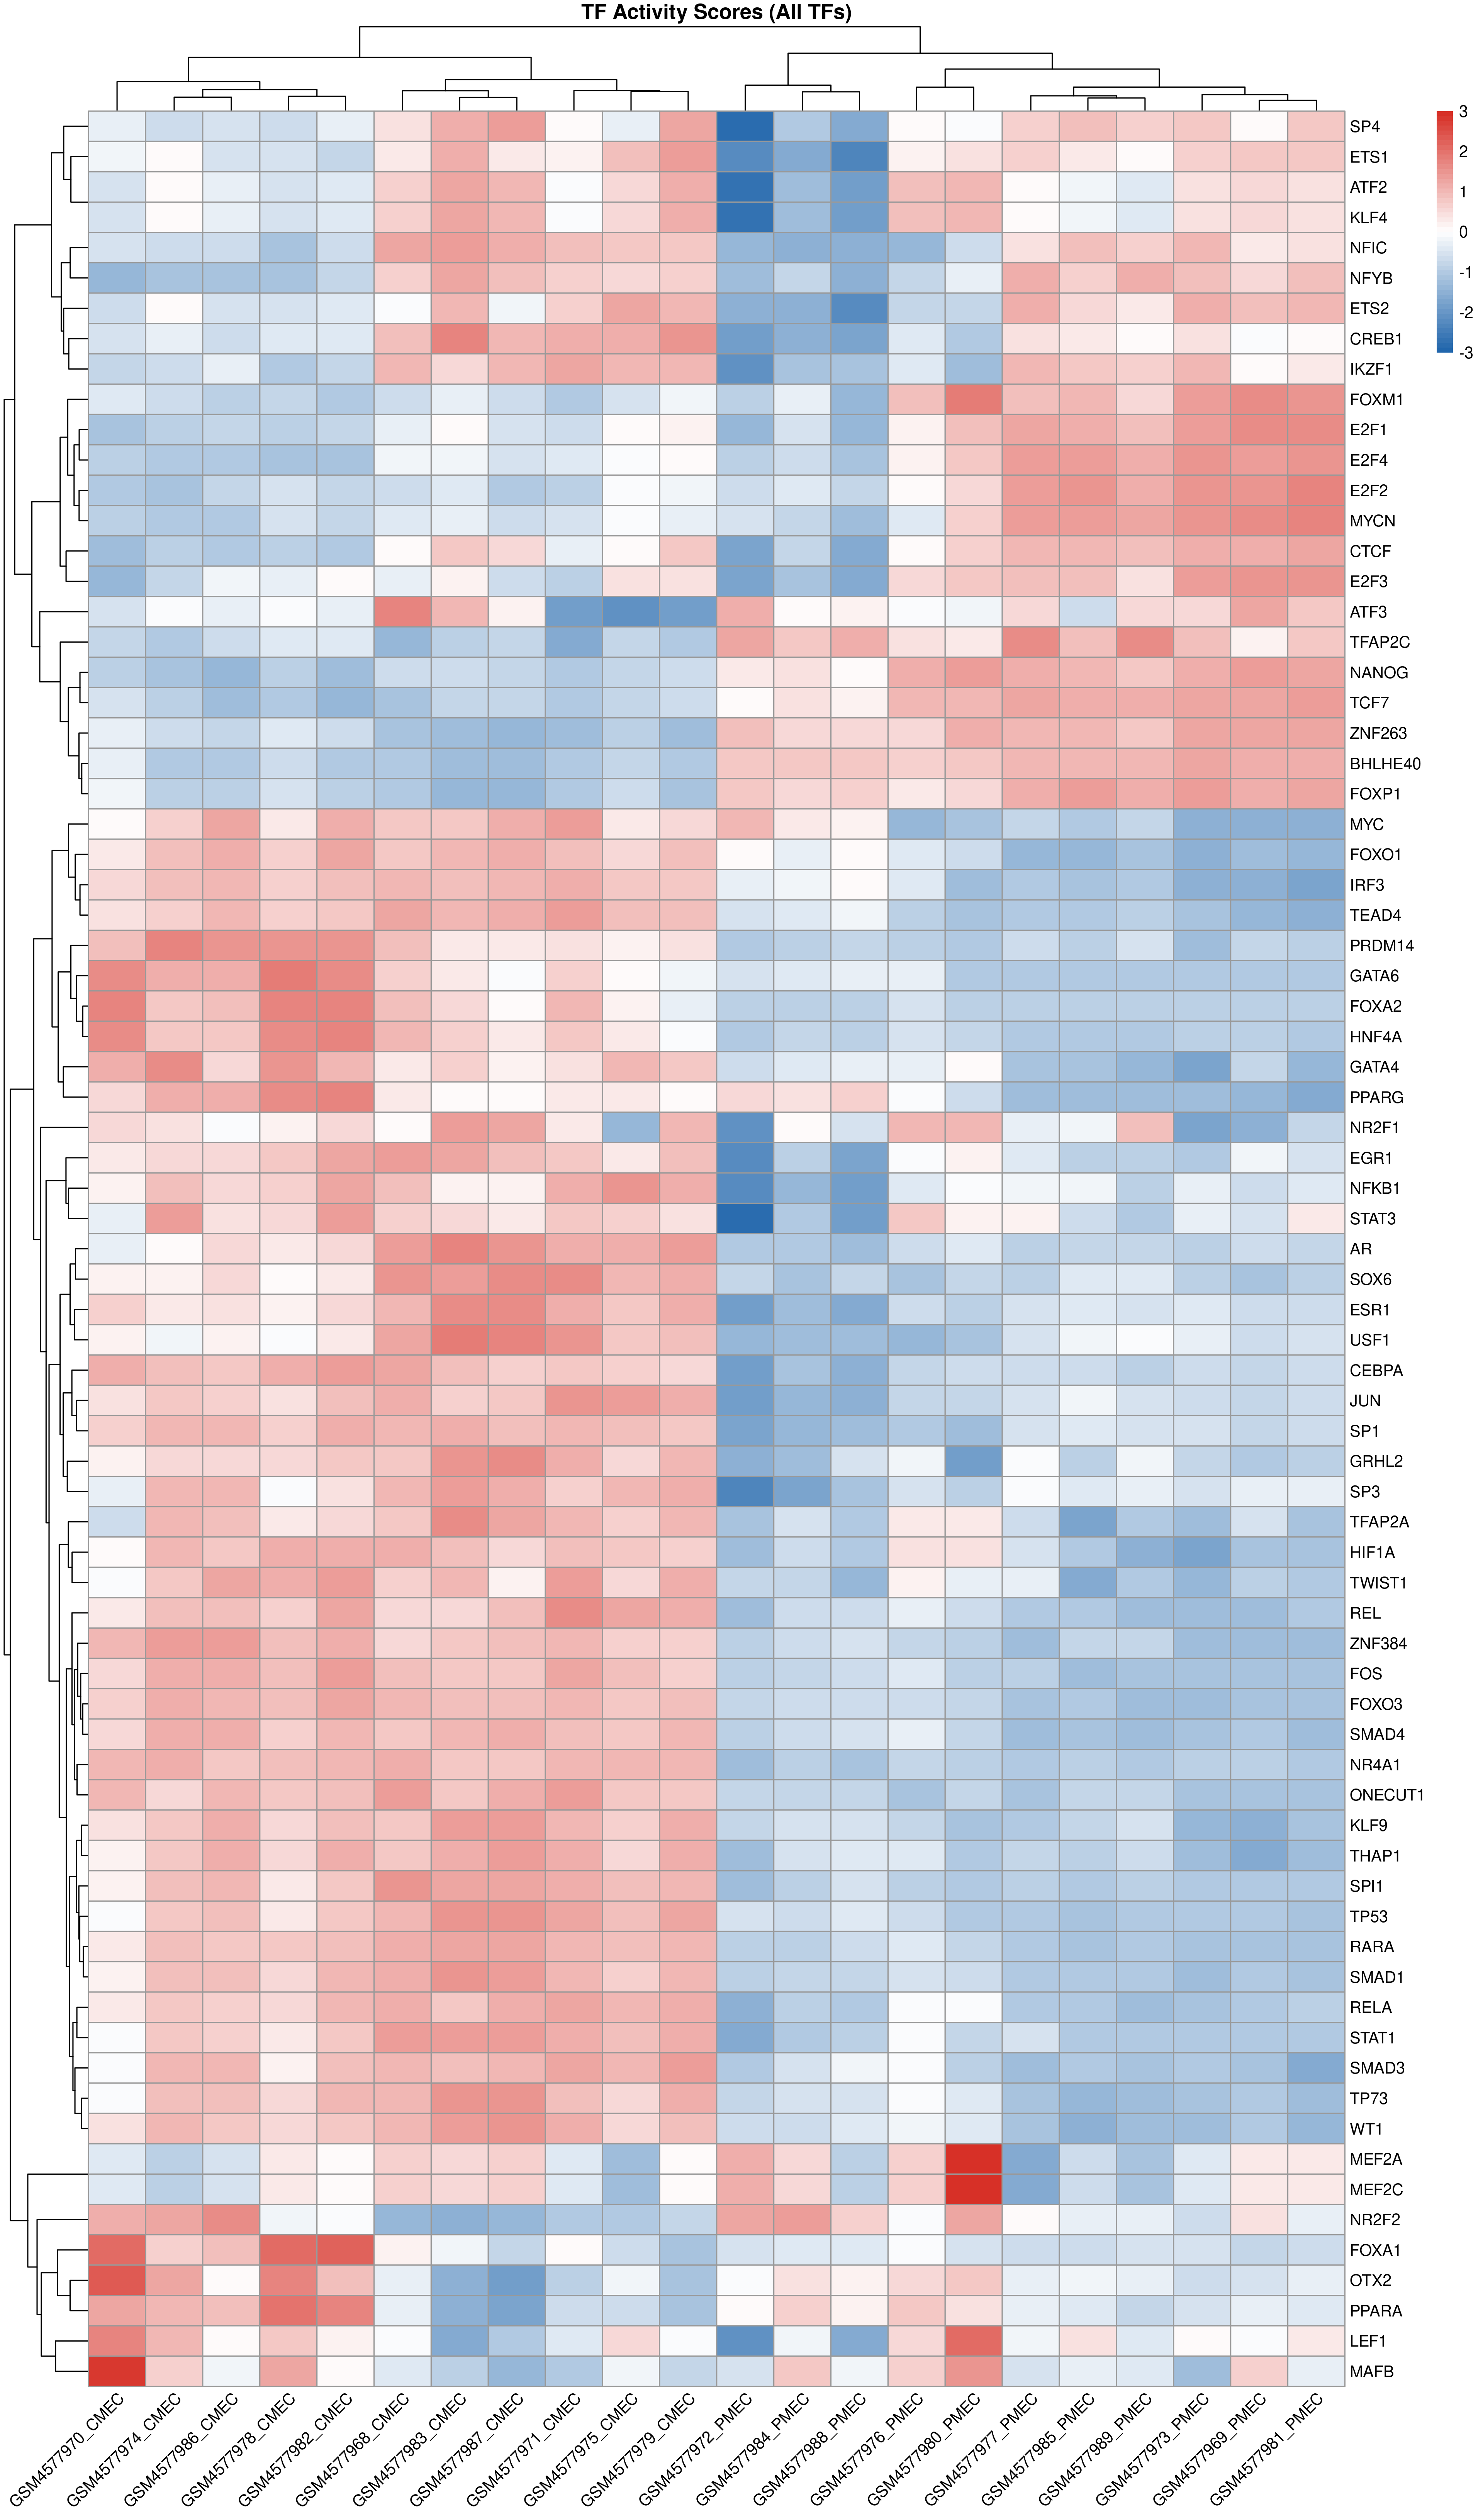
Gene Regulatory Networks
Identify transcription factors controlling your DEGs and their regulatory relationships.
Executive Summary
8 TFs controlling 607 interactions. EGR1 is the top master regulator.
Master Regulators
| Rank | TF | Targets | Act % | Role | Druggable |
|---|---|---|---|---|---|
| 1 | EGR1 | 124 | 92% | Activator | Yes |
| 2 | NR2F1 | 68 | 91% | Activator | Yes |
| 3 | MAFB | 53 | 100% | Activator | Yes |
| 4 | MYCN | 13 | 92% | Activator | No |
| 5 | GATA4 | 10 | 90% | Activator | Yes |
TF Activity Heatmap
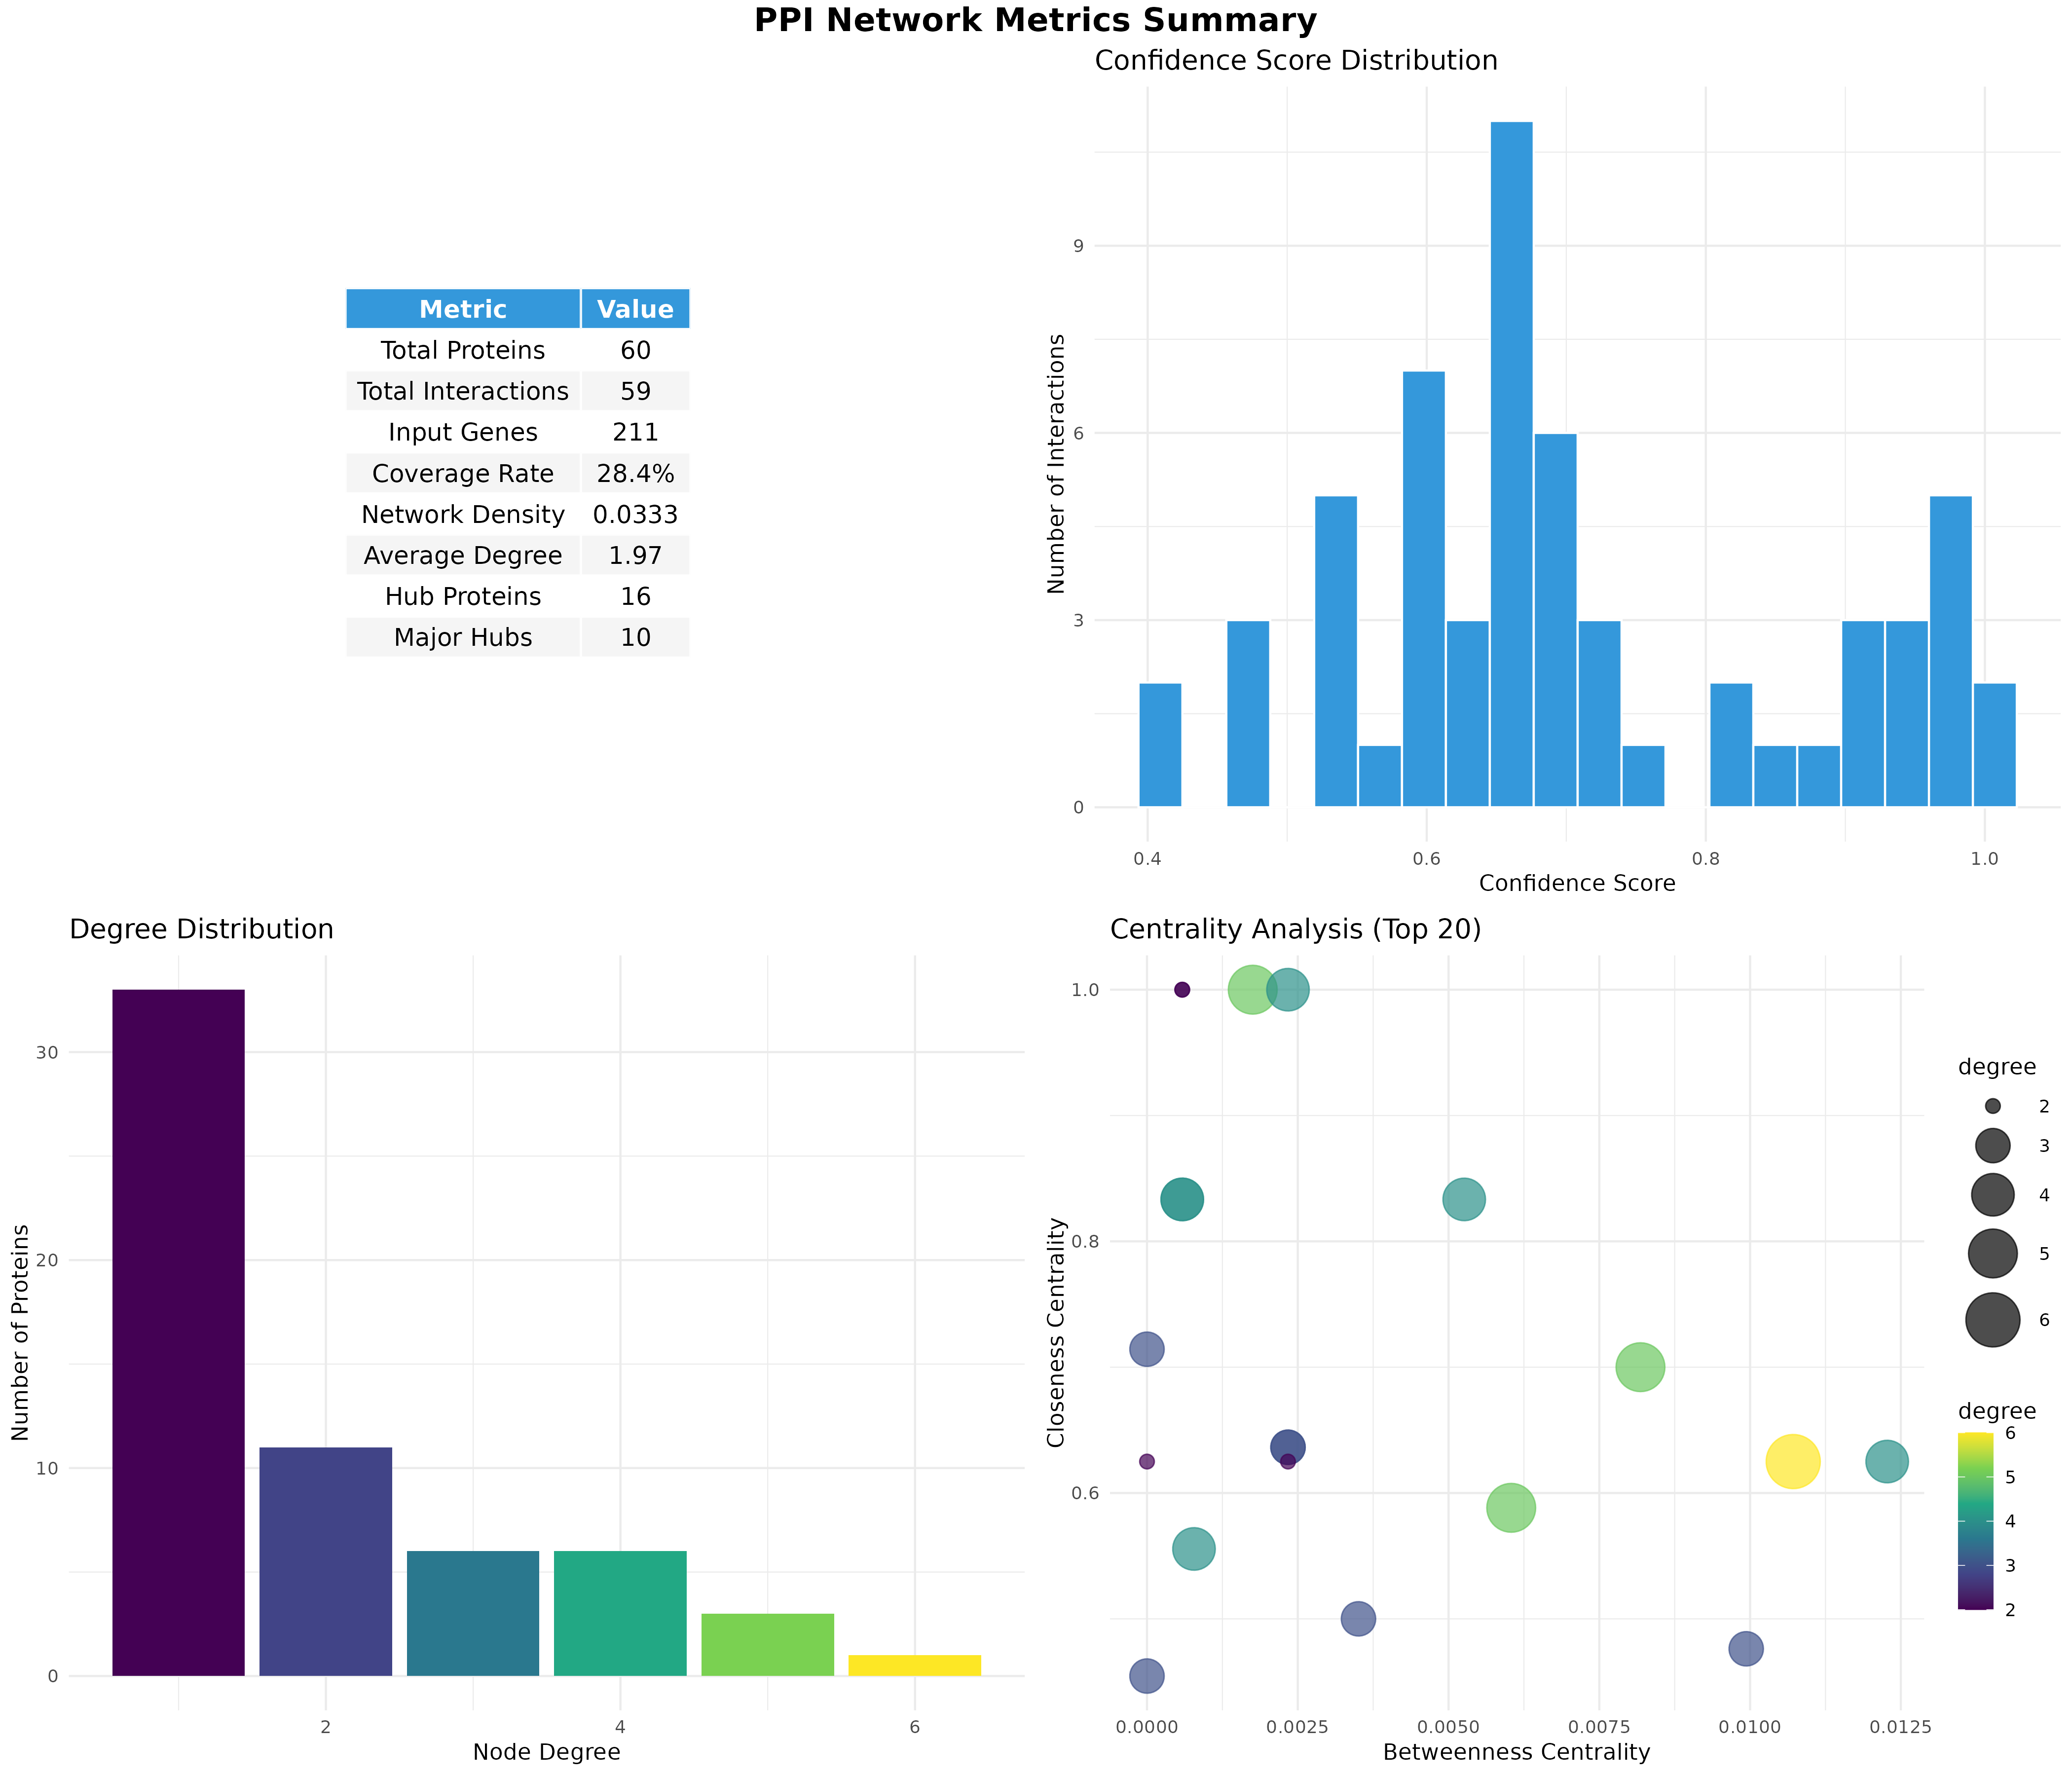
PPI Network Analysis
Map DEGs onto protein interaction databases to identify hub proteins.
Analysis Modes
Physical Network
Validated physical interactions only
Full Network
All interaction types
Network Statistics
Interactive Network
Hub Proteins
| Protein | Degree | Hub Type | Score | Regulation |
|---|---|---|---|---|
| APOE | 6 | Major Hub | 10.13 | Down |
| APOA1 | 5 | Major Hub | 7.47 | Down |
| CYP2S1 | 5 | Major Hub | 4.43 | Down |
| MCM10 | 5 | Major Hub | 2.11 | Up |
| GATA4 | 4 | Major Hub | 2.63 | Down |
Network Metrics
Frequently Asked Questions
edgeR: Good for larger datasets, slightly faster.
limma-voom: Best for complex designs with multiple factors.
Detailed: Adds OpenTargets clinical evidence.
Comprehensive: Both databases + prioritization scoring. Recommended for publications.
Full: Includes co-expression, text-mining, genetic interactions. More comprehensive but may include indirect associations.
Negative correlation (blue): Module genes downregulated.
Focus on modules with p < 0.05 and |correlation| > 0.5 for biological interpretation.